Pylab - Matlab style Python
Pylab is a module that provides a Matlab like namespace by importing functions from the modules Numpy and Matplotlib. Numpy provides efficient numerical vector calculations based on underlying Fortran and C binary libraries. Matplotlib contains functions to create visualizations of data.
# this ipython magic command imports pylab and allows the plots to reside within the notebook
%pylab inline
Populating the interactive namespace from numpy and matplotlib
Value error parsing header in AFM: b'UnderlinePosition' b'-133rUnderlineThickness 20rVersion 7.000'
The following examples are based on Florian Lhuillier’s lecture on Matlab which can be found online:
http://geophysik.uni-muenchen.de/~lhuillier/teaching/AD2010/
Examples based on “Rappels d’utilisation de MATLAB”
numpy.array
M = array(((1,2,3), (4,5,6), (7,8,9)))
M
array([[1, 2, 3],
       [4, 5, 6],
       [7, 8, 9]])
L=array((1,2,3))
C=array((1,2,3)).T
L, C
(array([1, 2, 3]), array([1, 2, 3]))
t1=arange(1,11); t1
array([ 1, 2, 3, 4, 5, 6, 7, 8, 9, 10])
t2=arange(1,11,2); t2
array([1, 3, 5, 7, 9])
t3=arange(10,0,-1); t3
array([10, 9, 8, 7, 6, 5, 4, 3, 2, 1])
get specific elements
t1
array([ 1, 2, 3, 4, 5, 6, 7, 8, 9, 10])
t1[4]
5
t1[[0,4,9]]
array([ 1, 5, 10])
t1[0:5]
array([1, 2, 3, 4, 5])
t1[0::2]
array([1, 3, 5, 7, 9])
t1[1::2]
array([ 2, 4, 6, 8, 10])
t1>5
array([False, False, False, False, False, True, True, True, True, True], dtype=bool)
t1[t1>5]
array([ 6, 7, 8, 9, 10])
t1%2==0
array([False, True, False, True, False, True, False, True, False, True], dtype=bool)
t1[t1%2==0]
array([ 2, 4, 6, 8, 10])
t1%2==1
array([ True, False, True, False, True, False, True, False, True, False], dtype=bool)
t1[t1%2==1]
array([1, 3, 5, 7, 9])
Matplotlib plotting
t = arange( -2*pi,2*pi,0.1); t
array([-6.28318531, -6.18318531, -6.08318531, -5.98318531, -5.88318531,
       -5.78318531, -5.68318531, -5.58318531, -5.48318531, -5.38318531,
       -5.28318531, -5.18318531, -5.08318531, -4.98318531, -4.88318531,
       -4.78318531, -4.68318531, -4.58318531, -4.48318531, -4.38318531,
       -4.28318531, -4.18318531, -4.08318531, -3.98318531, -3.88318531,
       -3.78318531, -3.68318531, -3.58318531, -3.48318531, -3.38318531,
       -3.28318531, -3.18318531, -3.08318531, -2.98318531, -2.88318531,
       -2.78318531, -2.68318531, -2.58318531, -2.48318531, -2.38318531,
       -2.28318531, -2.18318531, -2.08318531, -1.98318531, -1.88318531,
       -1.78318531, -1.68318531, -1.58318531, -1.48318531, -1.38318531,
       -1.28318531, -1.18318531, -1.08318531, -0.98318531, -0.88318531,
       -0.78318531, -0.68318531, -0.58318531, -0.48318531, -0.38318531,
       -0.28318531, -0.18318531, -0.08318531,  0.01681469,  0.11681469,
        0.21681469,  0.31681469,  0.41681469,  0.51681469,  0.61681469,
        0.71681469,  0.81681469,  0.91681469,  1.01681469,  1.11681469,
        1.21681469,  1.31681469,  1.41681469,  1.51681469,  1.61681469,
        1.71681469,  1.81681469,  1.91681469,  2.01681469,  2.11681469,
        2.21681469,  2.31681469,  2.41681469,  2.51681469,  2.61681469,
        2.71681469,  2.81681469,  2.91681469,  3.01681469,  3.11681469,
        3.21681469,  3.31681469,  3.41681469,  3.51681469,  3.61681469,
        3.71681469,  3.81681469,  3.91681469,  4.01681469,  4.11681469,
        4.21681469,  4.31681469,  4.41681469,  4.51681469,  4.61681469,
        4.71681469,  4.81681469,  4.91681469,  5.01681469,  5.11681469,
        5.21681469,  5.31681469,  5.41681469,  5.51681469,  5.61681469,
        5.71681469,  5.81681469,  5.91681469,  6.01681469,  6.11681469,
        6.21681469])
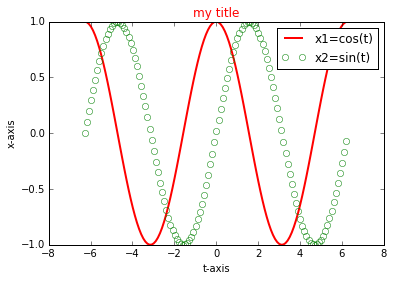
x1=cos(t)
x2=sin(t)
len(x2)
126
plot(t,x1, color='r', linewidth=2, label='x1=cos(t)')
plot(t, x2, ' o', markeredgecolor='g', markerfacecolor="None", label='x2=sin(t)')
title('my title', color='r')
xlabel('t-axis')
ylabel('x-axis')
legend()
<matplotlib.legend.Legend at 0x7f5fe9c0dc18>
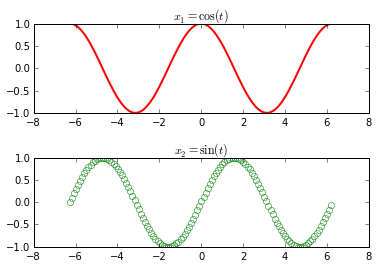
subplot(211)
plot(t, x1, 'r', linewidth=2)
title('$x_1=\cos(t)$')
subplot(212)
plot(t, x2, ' o', markeredgecolor='g', markerfacecolor="None")
title('$x_2=\sin(t)$')
subplots_adjust(hspace=.5)
Examples based on “familiarisation avec Matlab”
set_printoptions(precision=2, suppress=True)
Excercise 1
x=array((17,8,12,15,6,11,9,18,16,10,13,19)); x
array([17, 8, 12, 15, 6, 11, 9, 18, 16, 10, 13, 19])
N = len(x); N
12
S = sum(x); S
154
xbarre = S / N; xbarre
12.833333333333334
xbarre = mean( x); xbarre
12.833333333333334
sigma = sqrt(sum((x-xbarre)**2)/(N-1)); sigma
4.1959576506514704
sigma = std(x, ddof=1); sigma
4.1959576506514704
dx = x[1:]-x[0:-1]; dx
array([-9, 4, 3, -9, 5, -2, 9, -2, -6, 3, 6])
dx = diff(x); dx
array([-9, 4, 3, -9, 5, -2, 9, -2, -6, 3, 6])
Excercise 2
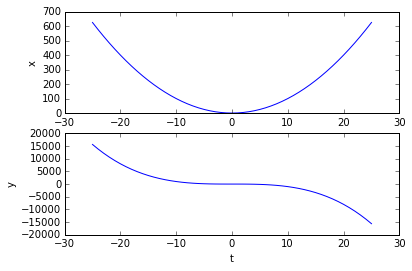
t = linspace(-25,25,51); t
array([-25., -24., -23., -22., -21., -20., -19., -18., -17., -16., -15.,
       -14., -13., -12., -11., -10.,  -9.,  -8.,  -7.,  -6.,  -5.,  -4.,
        -3.,  -2.,  -1.,   0.,   1.,   2.,   3.,   4.,   5.,   6.,   7.,
         8.,   9.,  10.,  11.,  12.,  13.,  14.,  15.,  16.,  17.,  18.,
        19.,  20.,  21.,  22.,  23.,  24.,  25.])
x = t**2; x
array([ 625.,  576.,  529.,  484.,  441.,  400.,  361.,  324.,  289.,
        256.,  225.,  196.,  169.,  144.,  121.,  100.,   81.,   64.,
         49.,   36.,   25.,   16.,    9.,    4.,    1.,    0.,    1.,
          4.,    9.,   16.,   25.,   36.,   49.,   64.,   81.,  100.,
        121.,  144.,  169.,  196.,  225.,  256.,  289.,  324.,  361.,
        400.,  441.,  484.,  529.,  576.,  625.])
y = t[::-1]**3; y
array([ 15625.,  13824.,  12167.,  10648.,   9261.,   8000.,   6859.,
         5832.,   4913.,   4096.,   3375.,   2744.,   2197.,   1728.,
         1331.,   1000.,    729.,    512.,    343.,    216.,    125.,
           64.,     27.,      8.,      1.,      0.,     -1.,     -8.,
          -27.,    -64.,   -125.,   -216.,   -343.,   -512.,   -729.,
        -1000.,  -1331.,  -1728.,  -2197.,  -2744.,  -3375.,  -4096.,
        -4913.,  -5832.,  -6859.,  -8000.,  -9261., -10648., -12167.,
       -13824., -15625.])
fliplr(t[newaxis])**3
array([[ 15625.,  13824.,  12167.,  10648.,   9261.,   8000.,   6859.,
          5832.,   4913.,   4096.,   3375.,   2744.,   2197.,   1728.,
          1331.,   1000.,    729.,    512.,    343.,    216.,    125.,
            64.,     27.,      8.,      1.,      0.,     -1.,     -8.,
           -27.,    -64.,   -125.,   -216.,   -343.,   -512.,   -729.,
         -1000.,  -1331.,  -1728.,  -2197.,  -2744.,  -3375.,  -4096.,
         -4913.,  -5832.,  -6859.,  -8000.,  -9261., -10648., -12167.,
        -13824., -15625.]])
subplot(2,1,1)
plot(t,x)
xlabel('t'); ylabel('x')
subplot(212)
plot(t,y)
xlabel('t'); ylabel('y')
<matplotlib.text.Text at 0x7f5fe95ac978>
fix(x/2)==x/2
array([False,  True, False,  True, False,  True, False,  True, False,
        True, False,  True, False,  True, False,  True, False,  True,
       False,  True, False,  True, False,  True, False,  True, False,
        True, False,  True, False,  True, False,  True, False,  True,
       False,  True, False,  True, False,  True, False,  True, False,
        True, False,  True, False,  True, False], dtype=bool)
sum( x[fix(x/2)==x/2])
5200.0
sum( x[remainder(x,2)==0])
5200.0
sum( x[x%2==0])
5200.0
sum( y[y>0])
105625.0
Excercise 3
t = arange(1,10.01,0.5); t
array([  1. ,   1.5,   2. ,   2.5,   3. ,   3.5,   4. ,   4.5,   5. ,
         5.5,   6. ,   6.5,   7. ,   7.5,   8. ,   8.5,   9. ,   9.5,  10. ])
A = array( (t, t**2, t**3, t**4)).T; A
array([[     1.  ,      1.  ,      1.  ,      1.  ],
       [     1.5 ,      2.25,      3.38,      5.06],
       [     2.  ,      4.  ,      8.  ,     16.  ],
       [     2.5 ,      6.25,     15.62,     39.06],
       [     3.  ,      9.  ,     27.  ,     81.  ],
       [     3.5 ,     12.25,     42.88,    150.06],
       [     4.  ,     16.  ,     64.  ,    256.  ],
       [     4.5 ,     20.25,     91.12,    410.06],
       [     5.  ,     25.  ,    125.  ,    625.  ],
       [     5.5 ,     30.25,    166.38,    915.06],
       [     6.  ,     36.  ,    216.  ,   1296.  ],
       [     6.5 ,     42.25,    274.62,   1785.06],
       [     7.  ,     49.  ,    343.  ,   2401.  ],
       [     7.5 ,     56.25,    421.88,   3164.06],
       [     8.  ,     64.  ,    512.  ,   4096.  ],
       [     8.5 ,     72.25,    614.12,   5220.06],
       [     9.  ,     81.  ,    729.  ,   6561.  ],
       [     9.5 ,     90.25,    857.38,   8145.06],
       [    10.  ,    100.  ,   1000.  ,  10000.  ]])
A = column_stack((A, t>5)); A
array([[     1.  ,      1.  ,      1.  ,      1.  ,      0.  ],
       [     1.5 ,      2.25,      3.38,      5.06,      0.  ],
       [     2.  ,      4.  ,      8.  ,     16.  ,      0.  ],
       [     2.5 ,      6.25,     15.62,     39.06,      0.  ],
       [     3.  ,      9.  ,     27.  ,     81.  ,      0.  ],
       [     3.5 ,     12.25,     42.88,    150.06,      0.  ],
       [     4.  ,     16.  ,     64.  ,    256.  ,      0.  ],
       [     4.5 ,     20.25,     91.12,    410.06,      0.  ],
       [     5.  ,     25.  ,    125.  ,    625.  ,      0.  ],
       [     5.5 ,     30.25,    166.38,    915.06,      1.  ],
       [     6.  ,     36.  ,    216.  ,   1296.  ,      1.  ],
       [     6.5 ,     42.25,    274.62,   1785.06,      1.  ],
       [     7.  ,     49.  ,    343.  ,   2401.  ,      1.  ],
       [     7.5 ,     56.25,    421.88,   3164.06,      1.  ],
       [     8.  ,     64.  ,    512.  ,   4096.  ,      1.  ],
       [     8.5 ,     72.25,    614.12,   5220.06,      1.  ],
       [     9.  ,     81.  ,    729.  ,   6561.  ,      1.  ],
       [     9.5 ,     90.25,    857.38,   8145.06,      1.  ],
       [    10.  ,    100.  ,   1000.  ,  10000.  ,      1.  ]])
column_stack((A, (fix(t)==t)*5))
array([[     1.  ,      1.  ,      1.  ,      1.  ,      0.  ,      5.  ],
       [     1.5 ,      2.25,      3.38,      5.06,      0.  ,      0.  ],
       [     2.  ,      4.  ,      8.  ,     16.  ,      0.  ,      5.  ],
       [     2.5 ,      6.25,     15.62,     39.06,      0.  ,      0.  ],
       [     3.  ,      9.  ,     27.  ,     81.  ,      0.  ,      5.  ],
       [     3.5 ,     12.25,     42.88,    150.06,      0.  ,      0.  ],
       [     4.  ,     16.  ,     64.  ,    256.  ,      0.  ,      5.  ],
       [     4.5 ,     20.25,     91.12,    410.06,      0.  ,      0.  ],
       [     5.  ,     25.  ,    125.  ,    625.  ,      0.  ,      5.  ],
       [     5.5 ,     30.25,    166.38,    915.06,      1.  ,      0.  ],
       [     6.  ,     36.  ,    216.  ,   1296.  ,      1.  ,      5.  ],
       [     6.5 ,     42.25,    274.62,   1785.06,      1.  ,      0.  ],
       [     7.  ,     49.  ,    343.  ,   2401.  ,      1.  ,      5.  ],
       [     7.5 ,     56.25,    421.88,   3164.06,      1.  ,      0.  ],
       [     8.  ,     64.  ,    512.  ,   4096.  ,      1.  ,      5.  ],
       [     8.5 ,     72.25,    614.12,   5220.06,      1.  ,      0.  ],
       [     9.  ,     81.  ,    729.  ,   6561.  ,      1.  ,      5.  ],
       [     9.5 ,     90.25,    857.38,   8145.06,      1.  ,      0.  ],
       [    10.  ,    100.  ,   1000.  ,  10000.  ,      1.  ,      5.  ]])
column_stack((A, (remainder(t,1)==0)*5))
array([[     1.  ,      1.  ,      1.  ,      1.  ,      0.  ,      5.  ],
       [     1.5 ,      2.25,      3.38,      5.06,      0.  ,      0.  ],
       [     2.  ,      4.  ,      8.  ,     16.  ,      0.  ,      5.  ],
       [     2.5 ,      6.25,     15.62,     39.06,      0.  ,      0.  ],
       [     3.  ,      9.  ,     27.  ,     81.  ,      0.  ,      5.  ],
       [     3.5 ,     12.25,     42.88,    150.06,      0.  ,      0.  ],
       [     4.  ,     16.  ,     64.  ,    256.  ,      0.  ,      5.  ],
       [     4.5 ,     20.25,     91.12,    410.06,      0.  ,      0.  ],
       [     5.  ,     25.  ,    125.  ,    625.  ,      0.  ,      5.  ],
       [     5.5 ,     30.25,    166.38,    915.06,      1.  ,      0.  ],
       [     6.  ,     36.  ,    216.  ,   1296.  ,      1.  ,      5.  ],
       [     6.5 ,     42.25,    274.62,   1785.06,      1.  ,      0.  ],
       [     7.  ,     49.  ,    343.  ,   2401.  ,      1.  ,      5.  ],
       [     7.5 ,     56.25,    421.88,   3164.06,      1.  ,      0.  ],
       [     8.  ,     64.  ,    512.  ,   4096.  ,      1.  ,      5.  ],
       [     8.5 ,     72.25,    614.12,   5220.06,      1.  ,      0.  ],
       [     9.  ,     81.  ,    729.  ,   6561.  ,      1.  ,      5.  ],
       [     9.5 ,     90.25,    857.38,   8145.06,      1.  ,      0.  ],
       [    10.  ,    100.  ,   1000.  ,  10000.  ,      1.  ,      5.  ]])
column_stack((A, (mod(t,1)==0)*5))
array([[     1.  ,      1.  ,      1.  ,      1.  ,      0.  ,      5.  ],
       [     1.5 ,      2.25,      3.38,      5.06,      0.  ,      0.  ],
       [     2.  ,      4.  ,      8.  ,     16.  ,      0.  ,      5.  ],
       [     2.5 ,      6.25,     15.62,     39.06,      0.  ,      0.  ],
       [     3.  ,      9.  ,     27.  ,     81.  ,      0.  ,      5.  ],
       [     3.5 ,     12.25,     42.88,    150.06,      0.  ,      0.  ],
       [     4.  ,     16.  ,     64.  ,    256.  ,      0.  ,      5.  ],
       [     4.5 ,     20.25,     91.12,    410.06,      0.  ,      0.  ],
       [     5.  ,     25.  ,    125.  ,    625.  ,      0.  ,      5.  ],
       [     5.5 ,     30.25,    166.38,    915.06,      1.  ,      0.  ],
       [     6.  ,     36.  ,    216.  ,   1296.  ,      1.  ,      5.  ],
       [     6.5 ,     42.25,    274.62,   1785.06,      1.  ,      0.  ],
       [     7.  ,     49.  ,    343.  ,   2401.  ,      1.  ,      5.  ],
       [     7.5 ,     56.25,    421.88,   3164.06,      1.  ,      0.  ],
       [     8.  ,     64.  ,    512.  ,   4096.  ,      1.  ,      5.  ],
       [     8.5 ,     72.25,    614.12,   5220.06,      1.  ,      0.  ],
       [     9.  ,     81.  ,    729.  ,   6561.  ,      1.  ,      5.  ],
       [     9.5 ,     90.25,    857.38,   8145.06,      1.  ,      0.  ],
       [    10.  ,    100.  ,   1000.  ,  10000.  ,      1.  ,      5.  ]])
column_stack((A, (t % 1==0)*5))
array([[     1.  ,      1.  ,      1.  ,      1.  ,      0.  ,      5.  ],
       [     1.5 ,      2.25,      3.38,      5.06,      0.  ,      0.  ],
       [     2.  ,      4.  ,      8.  ,     16.  ,      0.  ,      5.  ],
       [     2.5 ,      6.25,     15.62,     39.06,      0.  ,      0.  ],
       [     3.  ,      9.  ,     27.  ,     81.  ,      0.  ,      5.  ],
       [     3.5 ,     12.25,     42.88,    150.06,      0.  ,      0.  ],
       [     4.  ,     16.  ,     64.  ,    256.  ,      0.  ,      5.  ],
       [     4.5 ,     20.25,     91.12,    410.06,      0.  ,      0.  ],
       [     5.  ,     25.  ,    125.  ,    625.  ,      0.  ,      5.  ],
       [     5.5 ,     30.25,    166.38,    915.06,      1.  ,      0.  ],
       [     6.  ,     36.  ,    216.  ,   1296.  ,      1.  ,      5.  ],
       [     6.5 ,     42.25,    274.62,   1785.06,      1.  ,      0.  ],
       [     7.  ,     49.  ,    343.  ,   2401.  ,      1.  ,      5.  ],
       [     7.5 ,     56.25,    421.88,   3164.06,      1.  ,      0.  ],
       [     8.  ,     64.  ,    512.  ,   4096.  ,      1.  ,      5.  ],
       [     8.5 ,     72.25,    614.12,   5220.06,      1.  ,      0.  ],
       [     9.  ,     81.  ,    729.  ,   6561.  ,      1.  ,      5.  ],
       [     9.5 ,     90.25,    857.38,   8145.06,      1.  ,      0.  ],
       [    10.  ,    100.  ,   1000.  ,  10000.  ,      1.  ,      5.  ]])
column_stack((A, (A[:,1] % 1==0)*5))
array([[     1.  ,      1.  ,      1.  ,      1.  ,      0.  ,      5.  ],
       [     1.5 ,      2.25,      3.38,      5.06,      0.  ,      0.  ],
       [     2.  ,      4.  ,      8.  ,     16.  ,      0.  ,      5.  ],
       [     2.5 ,      6.25,     15.62,     39.06,      0.  ,      0.  ],
       [     3.  ,      9.  ,     27.  ,     81.  ,      0.  ,      5.  ],
       [     3.5 ,     12.25,     42.88,    150.06,      0.  ,      0.  ],
       [     4.  ,     16.  ,     64.  ,    256.  ,      0.  ,      5.  ],
       [     4.5 ,     20.25,     91.12,    410.06,      0.  ,      0.  ],
       [     5.  ,     25.  ,    125.  ,    625.  ,      0.  ,      5.  ],
       [     5.5 ,     30.25,    166.38,    915.06,      1.  ,      0.  ],
       [     6.  ,     36.  ,    216.  ,   1296.  ,      1.  ,      5.  ],
       [     6.5 ,     42.25,    274.62,   1785.06,      1.  ,      0.  ],
       [     7.  ,     49.  ,    343.  ,   2401.  ,      1.  ,      5.  ],
       [     7.5 ,     56.25,    421.88,   3164.06,      1.  ,      0.  ],
       [     8.  ,     64.  ,    512.  ,   4096.  ,      1.  ,      5.  ],
       [     8.5 ,     72.25,    614.12,   5220.06,      1.  ,      0.  ],
       [     9.  ,     81.  ,    729.  ,   6561.  ,      1.  ,      5.  ],
       [     9.5 ,     90.25,    857.38,   8145.06,      1.  ,      0.  ],
       [    10.  ,    100.  ,   1000.  ,  10000.  ,      1.  ,      5.  ]])
Excercise 4
def matrace(A):
    if A.shape[0] == A.shape[1]:  # square matrix
        return sum(A.diagonal())
    else:
        return -1
B = randn(10,2); B
array([[ 0.63495405, -0.41332203],
       [-0.7815181 , -0.13233533],
       [ 0.7135537 , -2.28650789],
       [ 1.06424592, -0.59932232],
       [-0.92327638,  1.08949032],
       [-0.3044619 , -1.41034731],
       [ 2.43510089,  1.79379768],
       [ 1.72210238, -0.07562774],
       [-1.01335264, -0.55329476],
       [-0.02516625,  0.3408787 ]])
C = rand(10,10); C
array([[ 0.50088428,  0.93300777,  0.37201697,  0.77327375,  0.46656404,
         0.62428764,  0.22893919,  0.05437433,  0.25646812,  0.61869992],
       [ 0.21738864,  0.14611412,  0.6931886 ,  0.01817277,  0.77878839,
         0.72566348,  0.04703873,  0.93371262,  0.83055894,  0.58275793],
       [ 0.4355275 ,  0.64907709,  0.74873456,  0.01012651,  0.24467361,
         0.2129306 ,  0.55225695,  0.84802033,  0.76059712,  0.4016598 ],
       [ 0.30799587,  0.27933615,  0.86267317,  0.39175961,  0.6428809 ,
         0.75737427,  0.41230321,  0.56131722,  0.69304986,  0.94859853],
       [ 0.62737424,  0.37229053,  0.75572847,  0.0568789 ,  0.94284048,
         0.97024807,  0.22325789,  0.93904313,  0.83170287,  0.65638246],
       [ 0.45016252,  0.68649037,  0.71527278,  0.16762903,  0.33766686,
         0.60118736,  0.34700568,  0.72236911,  0.70477416,  0.25416372],
       [ 0.61660476,  0.1965179 ,  0.28903584,  0.10889469,  0.76724818,
         0.68422022,  0.79335408,  0.46277956,  0.91468881,  0.67903228],
       [ 0.12111865,  0.59213305,  0.1991645 ,  0.08751303,  0.89810622,
         0.15385135,  0.90440875,  0.47300424,  0.92589573,  0.12016823],
       [ 0.04863678,  0.12421563,  0.44208702,  0.52011922,  0.4823349 ,
         0.27295407,  0.8477118 ,  0.77363518,  0.74753611,  0.01119114],
       [ 0.82594717,  0.33727314,  0.04060328,  0.28458626,  0.9967468 ,
         0.18169722,  0.10745559,  0.74661605,  0.42308565,  0.52056614]])
D = around(rand(10,10)*10); D
array([[  9.,   2.,   8.,   3.,   9.,   1.,   9.,   9.,   1.,   2.],
       [  8.,   5.,   8.,   3.,   3.,   7.,   2.,   4.,   4.,   8.],
       [  3.,   5.,   0.,   6.,   9.,   5.,  10.,   3.,   4.,   2.],
       [  3.,   9.,   9.,   9.,   2.,   1.,   8.,   3.,   6.,   1.],
       [  4.,   8.,   5.,   5.,   1.,   1.,   3.,   1.,   2.,  10.],
       [  8.,   9.,   8.,   7.,   4.,   7.,   9.,   1.,   3.,   6.],
       [  4.,   5.,   3.,   0.,   9.,   6.,   7.,   6.,   8.,   4.],
       [  3.,   6.,   6.,   2.,   1.,   7.,   2.,   5.,   4.,   1.],
       [  6.,   4.,   8.,   9.,   5.,   2.,   8.,   9.,   1.,   9.],
       [  9.,   8.,   5.,   7.,   6.,   6.,   2.,   5.,   6.,   2.]])
matrace(B), B.trace()
(-1, 0.50261872238441196)
matrace(D), D.trace()
(46.0, 46.0)
matrace(D.T), D.T.trace()
(46.0, 46.0)
matrace(inv(D)), inv(D).trace()
(1.2606176554219353, 1.2606176554219353)
F = array(((1,2,3),(-1,-2,-3),(2,1,0))); F
array([[ 1,  2,  3],
       [-1, -2, -3],
       [ 2,  1,  0]])
G = array(((1,2,3),(-1,-2,-3))); G
array([[ 1,  2,  3],
       [-1, -2, -3]])
matrace(F), F.trace() ## -1 = error or result?
(-1, -1)
matrace(G), G.trace() ## -1 = error or result?
(-1, -1)
Try to use exceptions to idicate an error condition!
def matrace(A):
    if A.shape[0] == A.shape[1]:  # square matrix
        return sum(A.diagonal())
    else:
        raise ValueError("Not a square matrix. Sorry.")
matrace(F), F.trace() ## -1 must is result
(-1, -1)
matrace(G), G.trace() ## error throws exception
---------------------------------------------------------------------------

ValueError                                Traceback (most recent call last)

<ipython-input-17-a14741b5c239> in <module>()
----> 1 matrace(G), G.trace()  ## error throws exception


<ipython-input-15-933595dad0e3> in matrace(A)
      3         return sum(A.diagonal())
      4     else:
----> 5         raise ValueError("Not a square matrix. Sorry.")


ValueError: Not a square matrix. Sorry.
try:
    matrace(G)
except( ValueError):
    print("Exception catched! Calculation of trace didn't work")
Exception catched! Calculation of trace didn't work