Rotational
and translational motions induced by local, regional and global seismic
events: I. - Observations and processing
Igel, H., Flaws,
A., Cochard, A. Wassermann, J., Schreiber, U., Velikoseltsev, A.
Abstract:
It
has been noted by theoretical seismologists for decades
that – in addition to translations and strains – the rotational part of
ground
motions should also be recorded. It is expected that collocated
measurements of
translations and rotations may (1) allow restitution of seismograms to
the
complete ground motion of an observation point; (2) help to further
constrain
rupture processes; (3) provide additional hazard-relevant information
to
earthquake engineers. The lack of instrumental resolution used to be
the main
obstacle to observing rotational motions. Recently, ring laser
technology has
provided the means to develop instruments that allow the observation of
rotational motions in a wide frequency band and epicentral distance
range. We
report observations of rotations around a vertical axis of several
large
earthquakes obtained by a 4x4m ring laser installed in SE-Germany and
compare
them to broadband translations. Assuming plane transverse wave
propagation
(e.g. Love waves), rotation rate and acceleration should be in phase
and
amplitudes scale linearly with the horizontal phase velocity. This
implies that
- in principle - collocated measurements of translations and rotations
would
allow estimation of Love-wave dispersion and thus provide additional
information not contained in classical three-component recordings. We
show observations from a data base with now approxl 40 seismic events.
The development of a prototype ring-laser based
instrument specifically designed for seismology has
been completed and is installed since early 2005 at Pinon
Flat observatory in Southern California for testing. We will report
preliminary
observations.
Preliminary
version of figures.
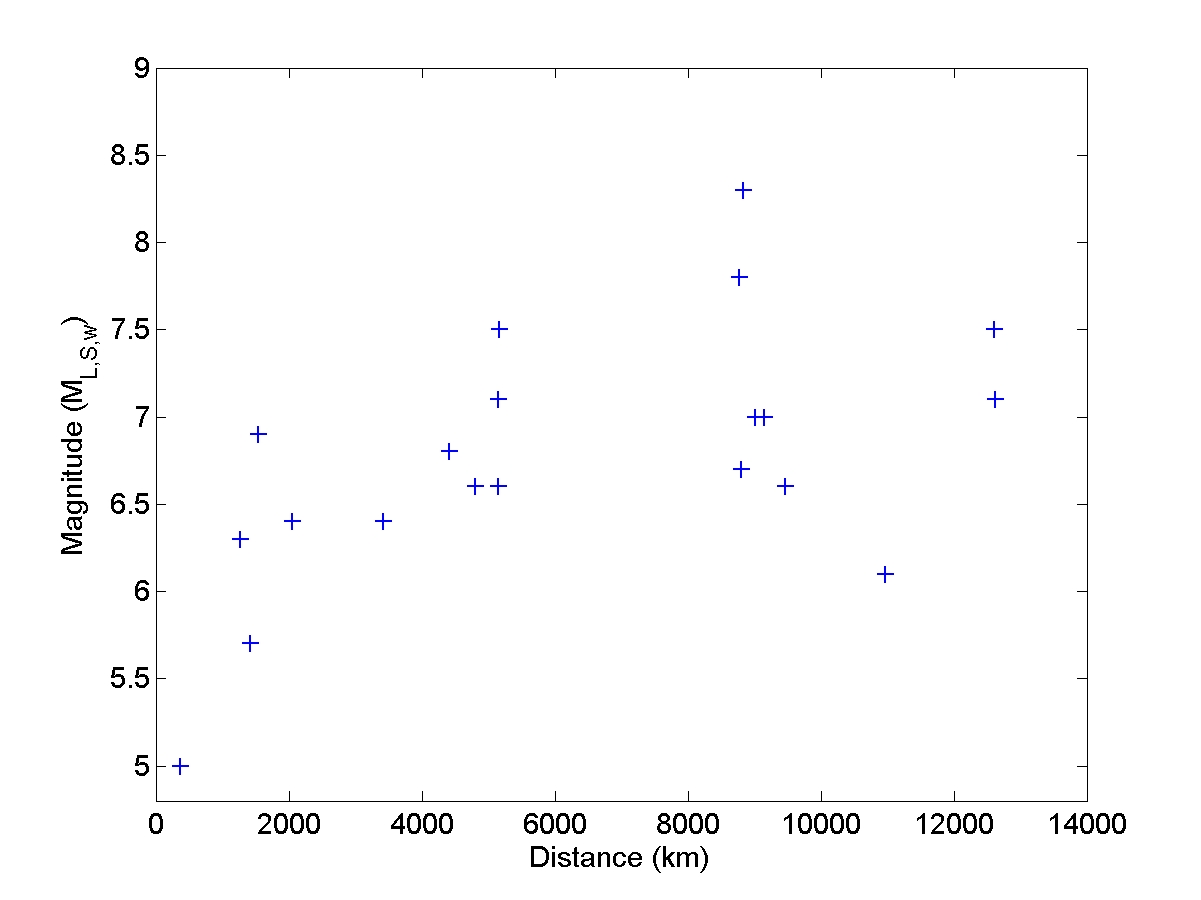
Fig. 1. Magnitude distribution
of processed events as a function of epicentral distance.
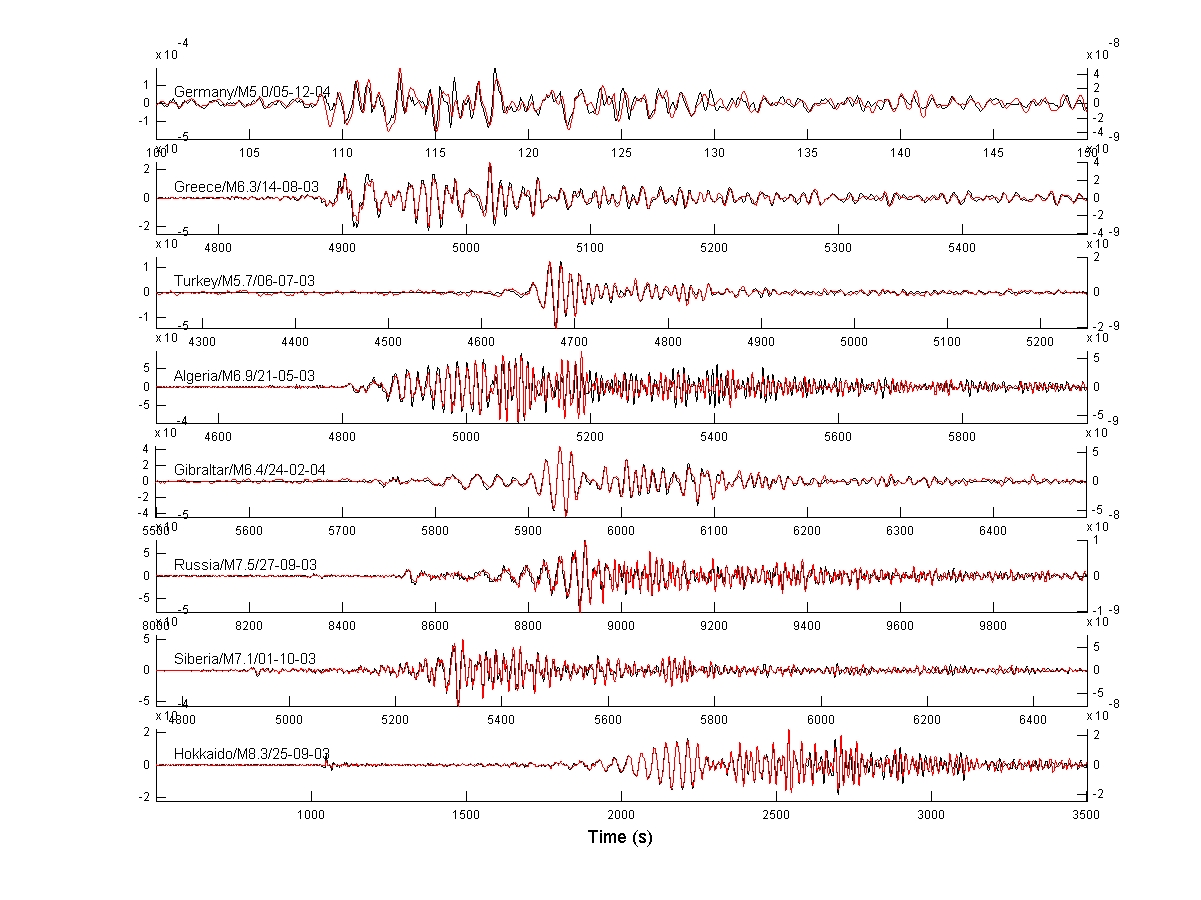
Fig. 2: Comparison of
transverse acceleration (black, left axis) and rotation rater (red,
right axis) for several events and frequency bands.
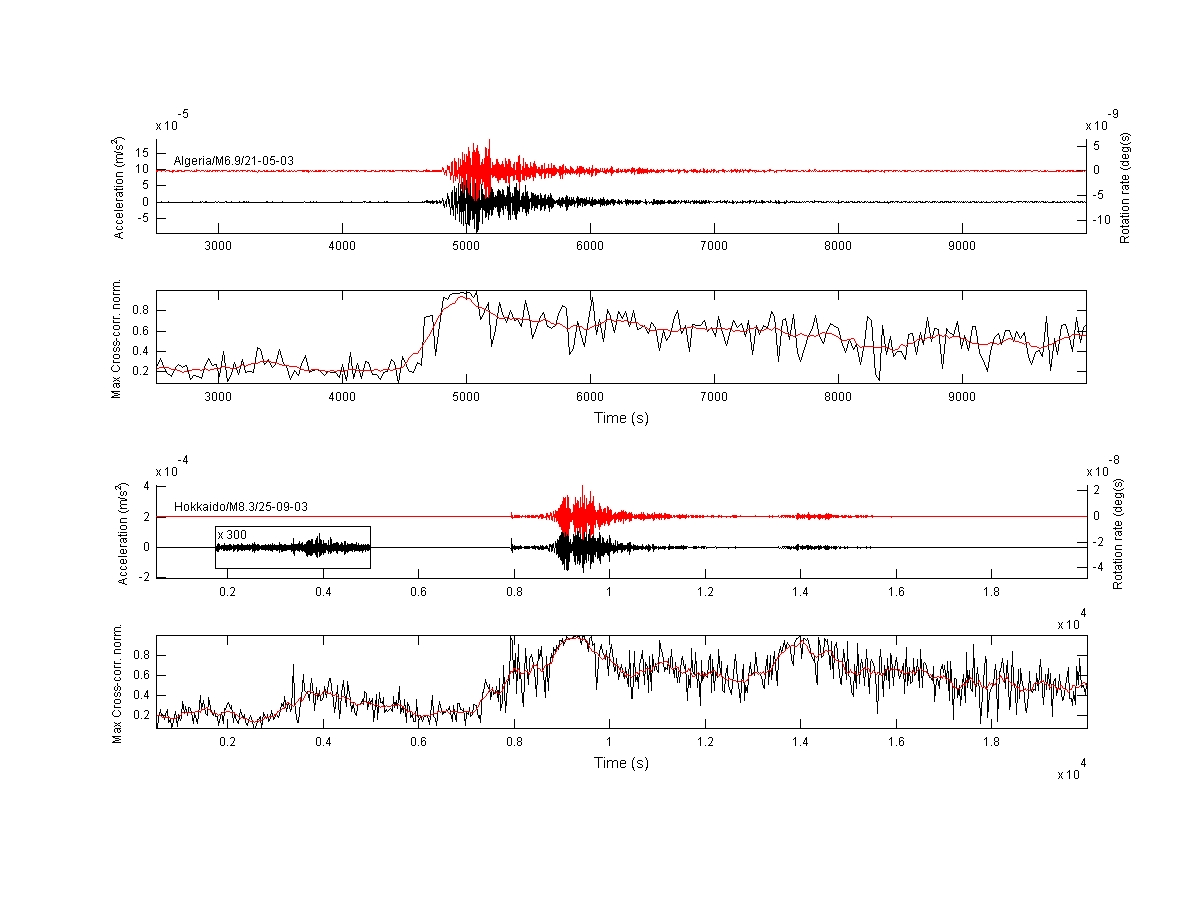
Fig. 3:
Maximum (positive) cross-correlation as a function of time for two
events between rotation rate (red) and transverse acceleration (black).
Note the excellent correlation for shear wave arrivals and surface
waves as well as the overall increased correlation after the first
break.
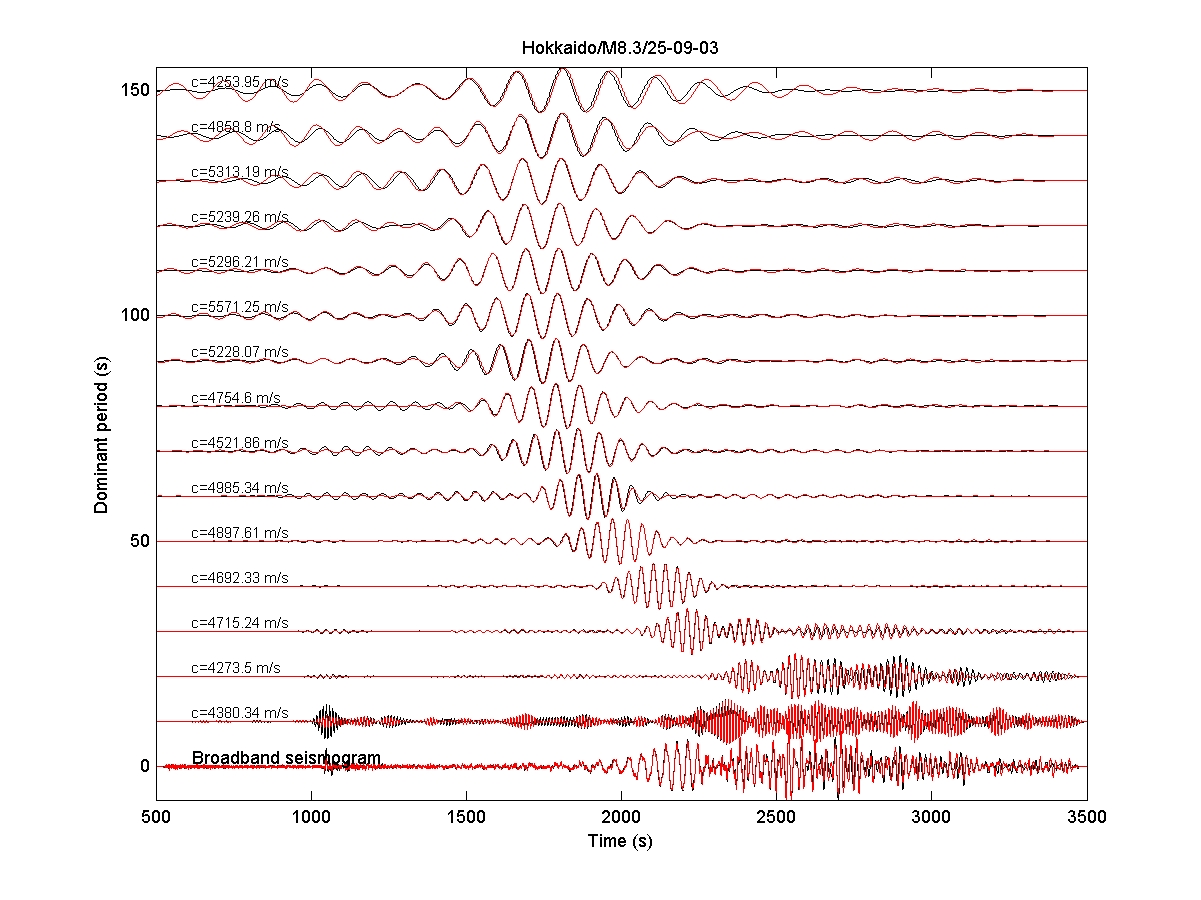
Fig. 4a:
Earthquake in Hokkaido. Comparison of transverse acceleration (black,
left axis) and rotation
rater (red, right axis) as a function of frequency using a very narrow
band filter with a dominante period given left.
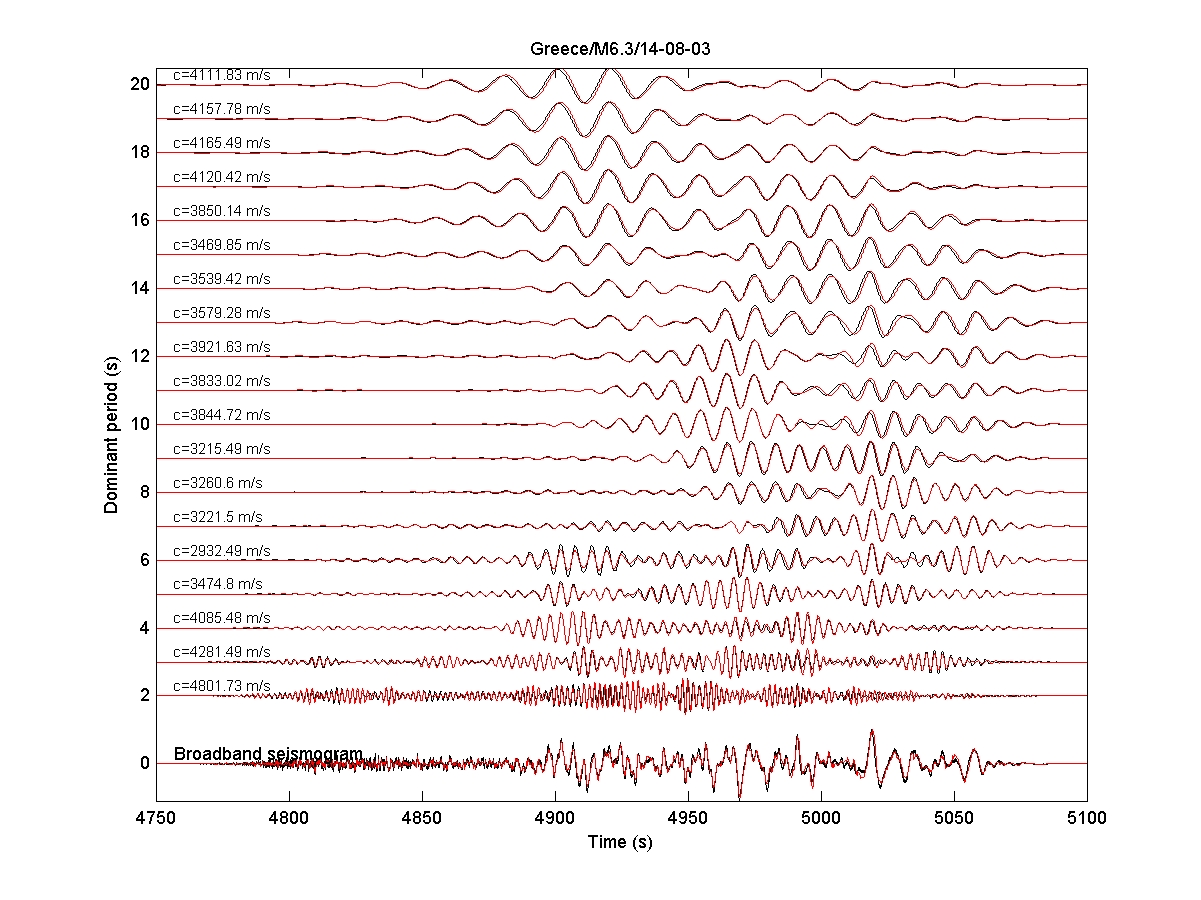
Fig. 4a:
Earthquake in Greece. Comparison of transverse acceleration (black,
left axis) and rotation
rater (red, right axis) as a function of frequency using a very narrow
band filter with a dominante period given left.
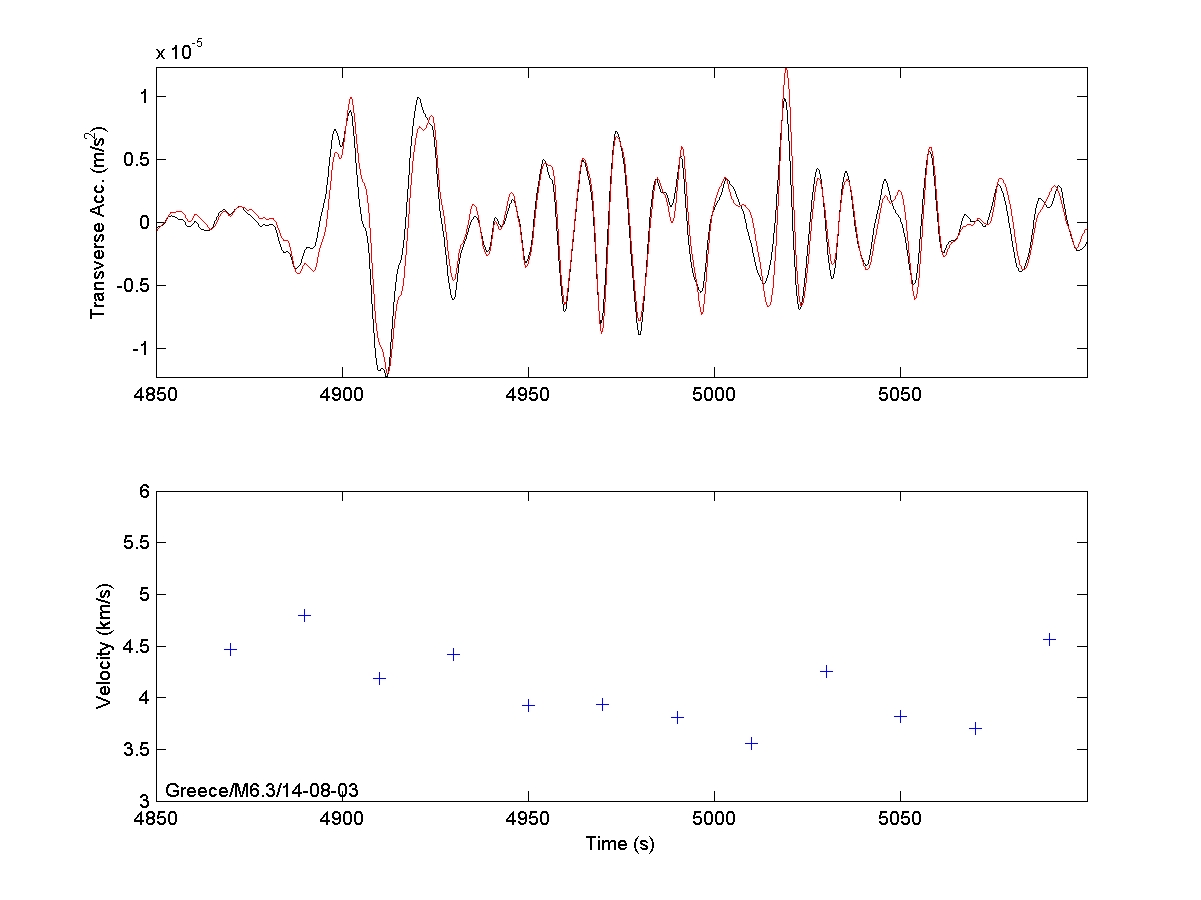
Fig. 5a:
Comparison of transverse acceleration (black, left axis) and rotation
rater (red, right axis) and determination of phase velocities as a
function of time.
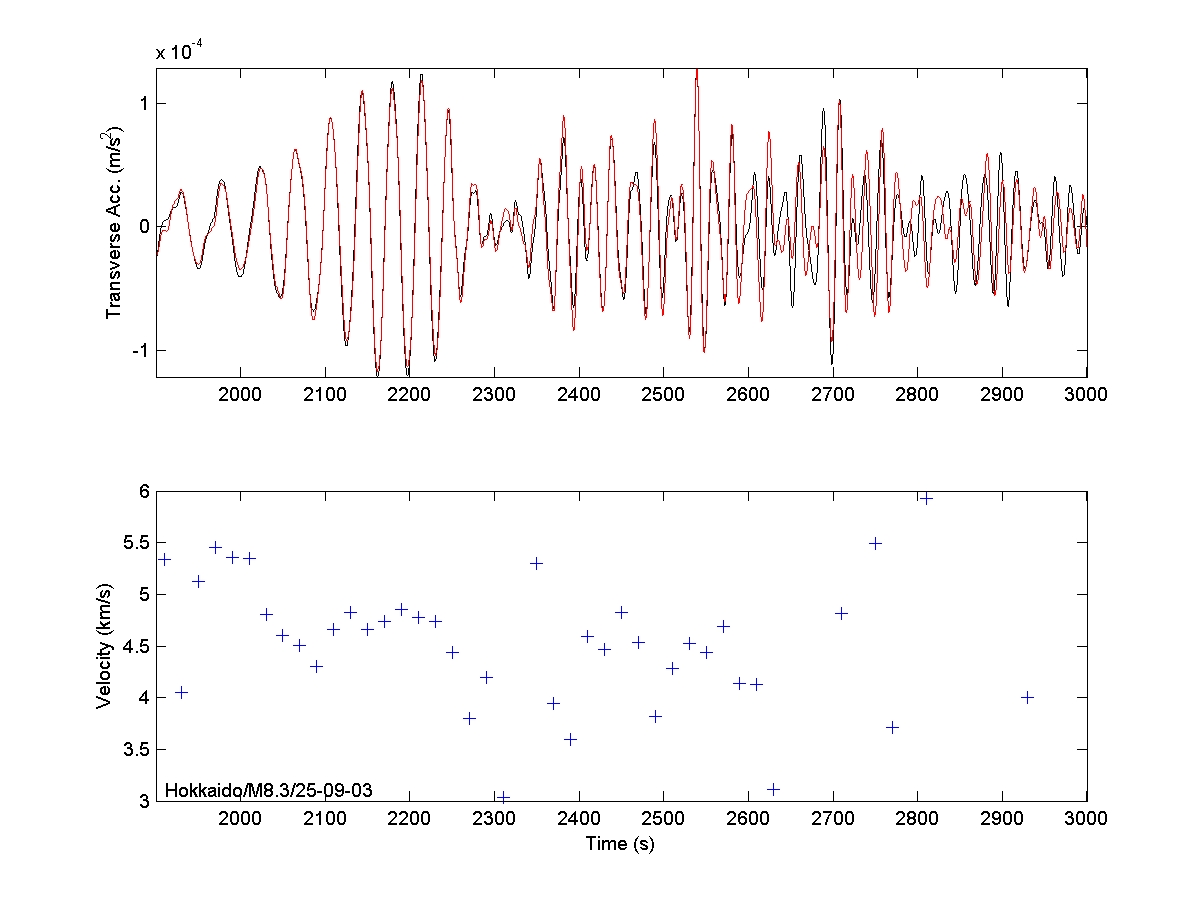
Fig. 5b:
Comparison of transverse acceleration (black, left axis) and rotation
rater (red, right axis) and determination of phase velocities as a
function of time.
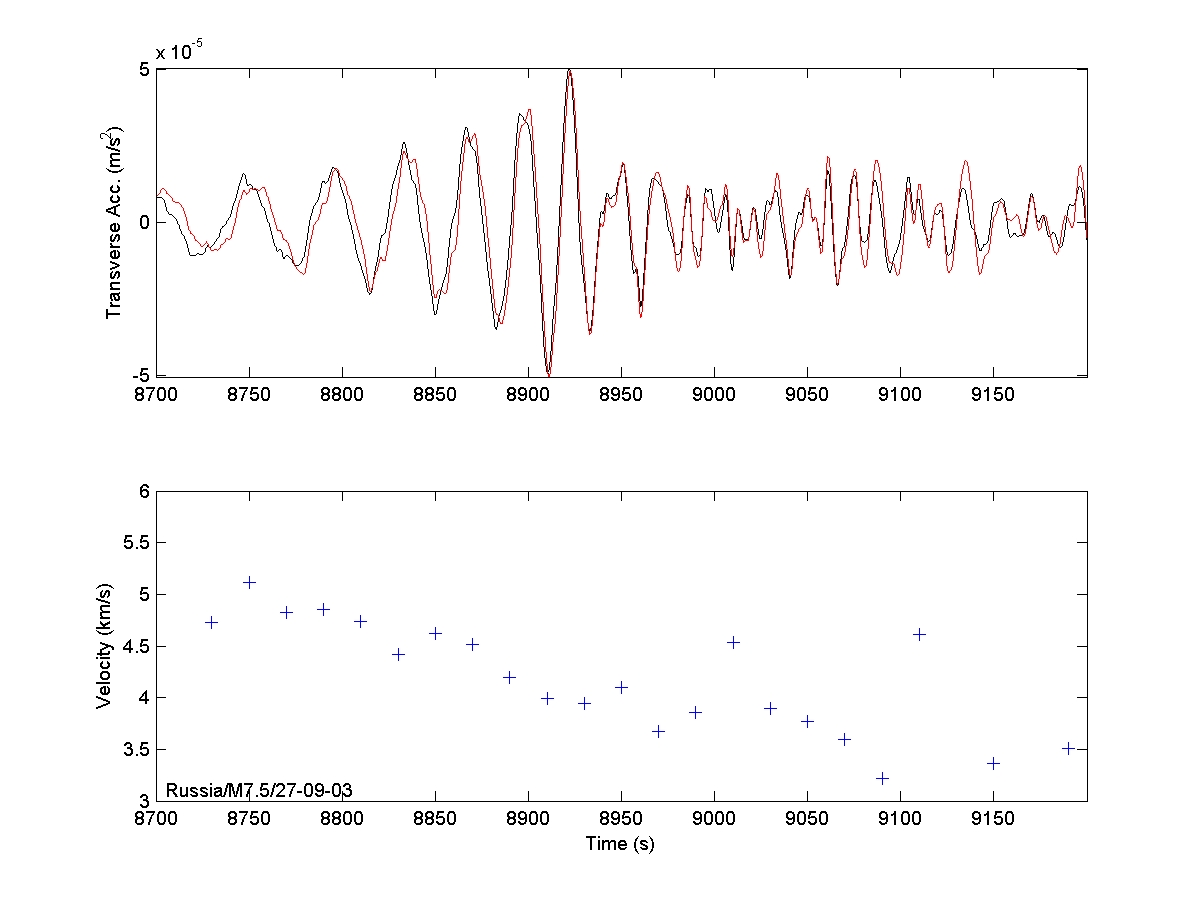
Fig. 5c:
Comparison of transverse acceleration (black, left axis) and rotation
rater (red, right axis) and determination of phase velocities as a
function of time.
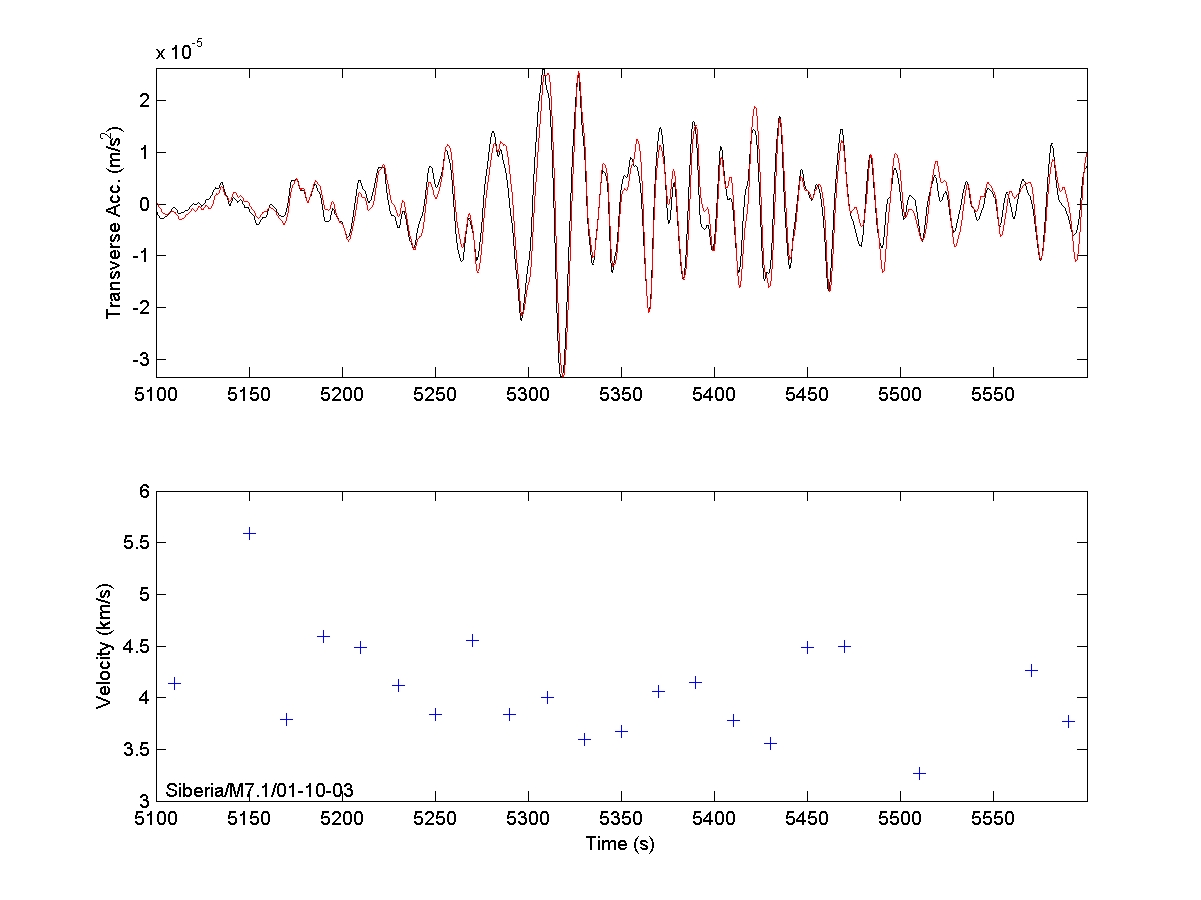
Fig. 5d:
Comparison of transverse acceleration (black, left axis) and rotation
rater (red, right axis) and determination of phase velocities as a
function of time.
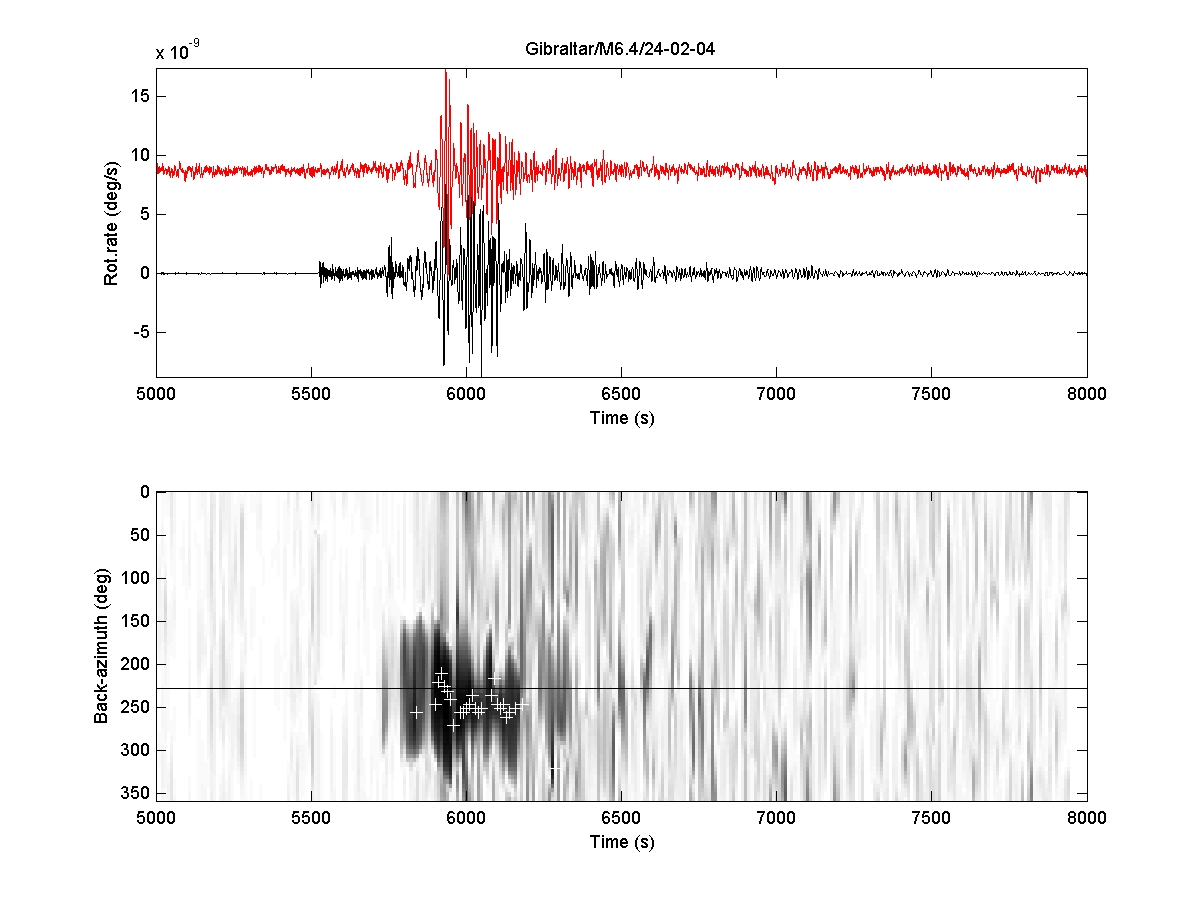
Fig. 6a:
Comparison of transverse acceleration (black, left axis) and rotation
rater (red, right axis) and determination correlation as a function of
backazimuth and time. The black line indicates the calculated
backazimuth for Station Wettzell. The white crosses are the locations
of maximum correlation when a certain threshold is reached (0.9). The
crosses may indicate backazimuthis of particular wave packets.
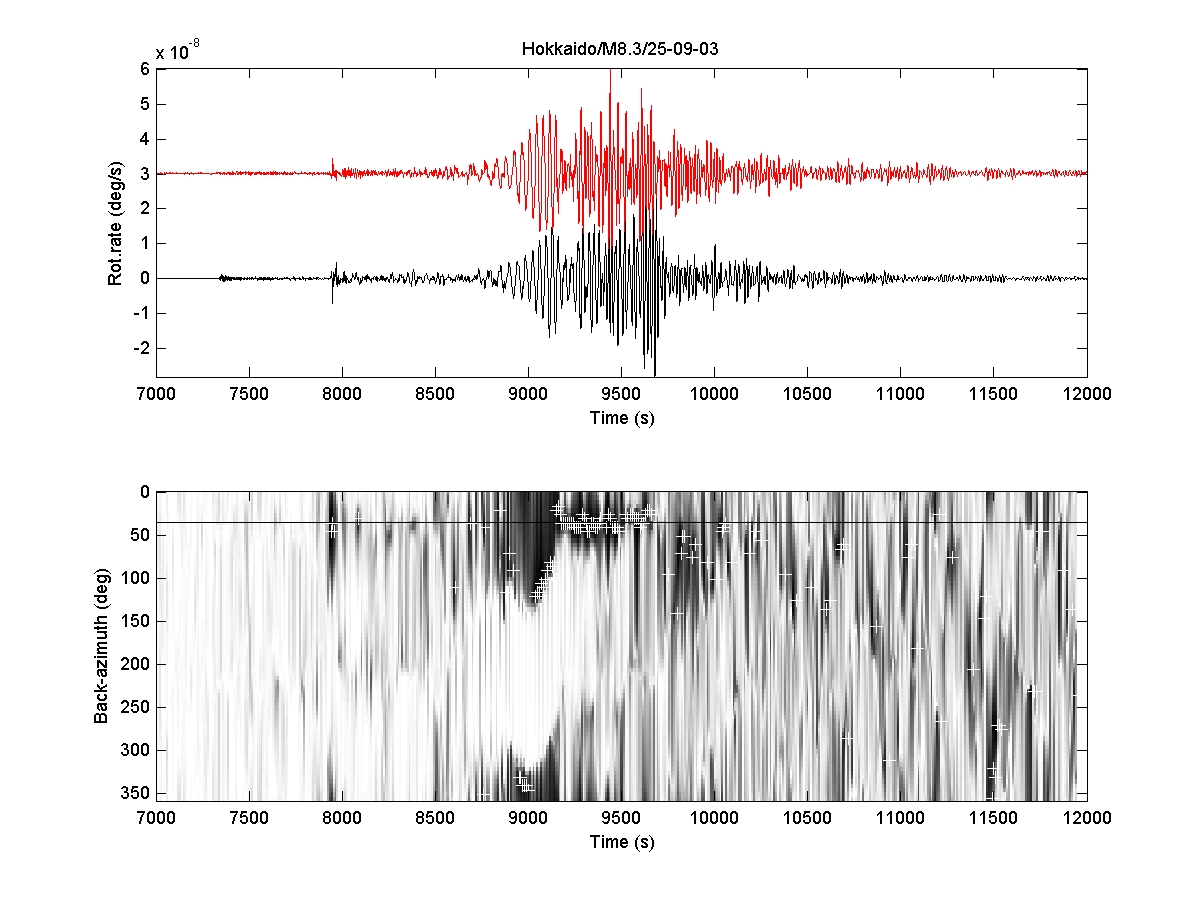
Fig. 6b:
Comparison of transverse acceleration (black, left axis) and rotation
rater (red, right axis) and determination correlation as a function of
backazimuth and time. The black line indicates the calculated
backazimuth for Station Wettzell.
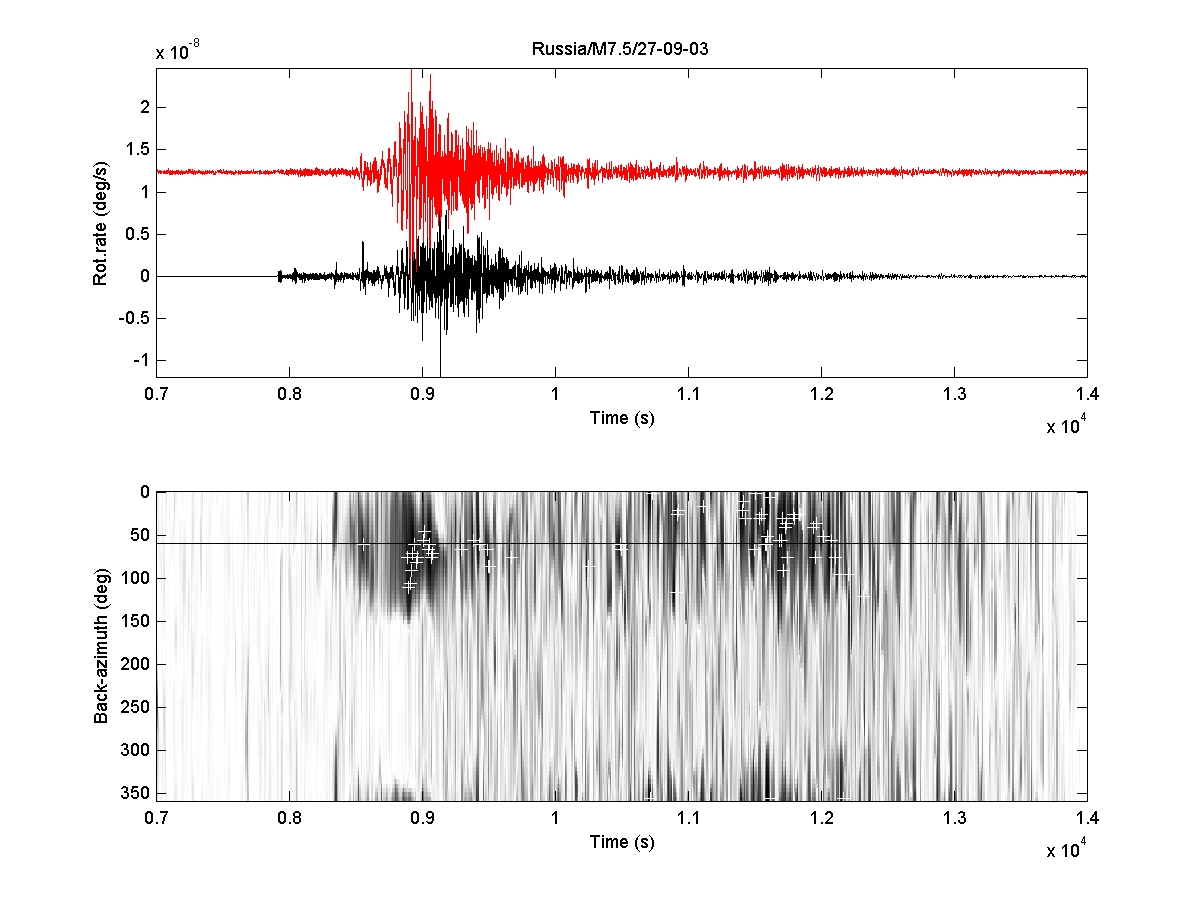
Fig. 6c:
Comparison of transverse acceleration (black, left axis) and rotation
rater (red, right axis) and determination correlation as a function of
backazimuth and time. The black line indicates the calculated
backazimuth for Station Wettzell.
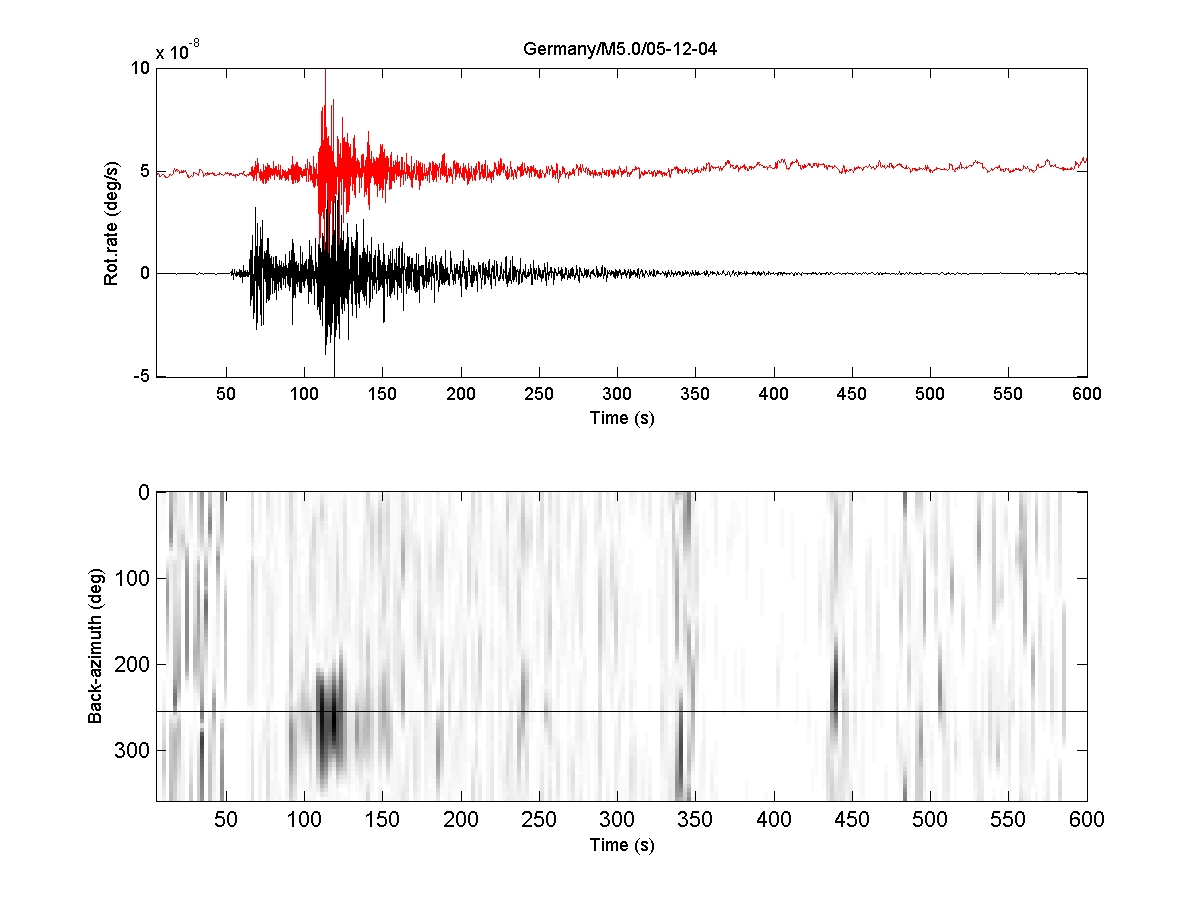
Fig. 6d:
Comparison of transverse acceleration (black, left axis) and rotation
rater (red, right axis) and determination correlation as a function of
backazimuth and time. The black line indicates the calculated
backazimuth for Station Wettzell.